
Top Picks Report – January 2022
New Year Special
Please refer to important disclosures at the end of this report
1

January 2022
2
Top Picks Report – January 2022
New Year Special
The Indian economy had staged a V-shaped recovery post the second Covid wave
in Q1FY2022 due to the quick reopening of the economy. Moreover strong festive
demand also helped the recovery process. The manufacturing PMI for November
hit a 10-month high of 56.3 while services PMI at 58.1 for November point to a
continued solid pace of expansion in the services sector. While we expect the
economic recovery to continue, high global inflation and aggressive tightening by
the US Fed will be key issues in CY2022, though the impact of Omicron variant
should be transient and limited to 1QCY2022. We are positive on banking and
Consumer-facing sectors as we do not see any long lasting impact from Omicron
and expect strong rebound in earnings for the sectors in FY2023. We also remain
positive on Chemicals and IT sector given high medium-term growth visibility for
both the sectors.
High-frequency indicators point to continued economic recovery
High-frequency indicators like PMI numbers, GST collection, and E-way bill
generation, etc. continue to point to a quicker than expected recovery in the
economy. Strong festive demand also contributed to the recovery process. The
manufacturing PMI for November hit a 10-month high of 56.3 and points to a
continued strong rebound in the manufacturing sector. Services PMI at 58.1 for
November also point to a continued solid pace of expansion post reading of 58.4 in
October. GST collection for Nov’21 was up by 25% Yoy to ₹1.31 lakh Cr. and
corroborates the economic recovery.
Accelerated tapering and Omicron strain contributing to uncertainties
Markets turned volatile from the second half of November due to the emergence of
Omicron strain of Coronavirus in South Africa (RSA) and accelerated tapering
timelines by the US Fed. In the Dec’21 FOMC meeting, the US Fed has accelerated
the timeline for tapering to Mar’22 from Jun’22 while the dot plots indicate at least
three rate hikes by the end of 2022. Accelerated tapering by the US Fed and the
rapid spread of Omicron globally has led to selloff by FII’s thus leading to increased
volatility in the markets.
High vaccination coverage should limit fallout from any potential third wave
India’s vaccination coverage has increased significantly over the past few months
with over 60%/41% of the total population being partially/fully vaccinated.
Moreover, anecdotal evidence suggests that though the Omicron strain is highly
contagious it doesn’t cause serious illness like the Delta variant. Increased
vaccination coverage and low severity should help in limiting the fallout from any
potential third wave due to the new Omicron strain.
Banking, Consumer-facing sectors to do well along with Chemicals & IT
Given the aggressive tightening by the US Fed, there will be a slowdown in FII flows
next year though domestic flows should remain robust and make up for any
shortfall in FII flow. From a sector perspective, we are positive on Banking, and
consumer-facing sectors given expectations of strong earnings growth in
FY2023E. We also remain positive on Chemicals and IT sector given high medium-
term growth visibility for both the sectors.
Top Picks
Company
CMP (`)
TP (`)
Auto
Ashok Leyland
123
175
Sona BLW Precis.
706
959
Ramkrishna Forg.
935
1545
Suprajit Engg.
420
520
Banking
Federal Bank
81
135
HDFC Bank
1450
1859
AU Small Finance
1006
1520
Chemical
P I Industries
2892
3440
IT
HCL Technologies
1267
1363
Others
Carborundum Uni.
921
1100
Stove Kraft
957
1288
Safari Inds.
869
1126
Sobha
864
1050
Amber Enterp.
3332
4150
Source: Company, Angel Research
CMP as on 27th Dec’21
January 2022
3
Top Picks Report – January 2022
New Year Special
Indian Economy has bounced back strongly post the second wave
Indian economy witnessed good momentum in Q2-Q3 FY22 in anticipation of
demand recovery as the festive season approached. For the second straight month
in Dec’21, gross GST collection crossed ₹1.30 lakh crore and was at second highest
levels ever, second only to April 2021 which gets influenced due to year-end and
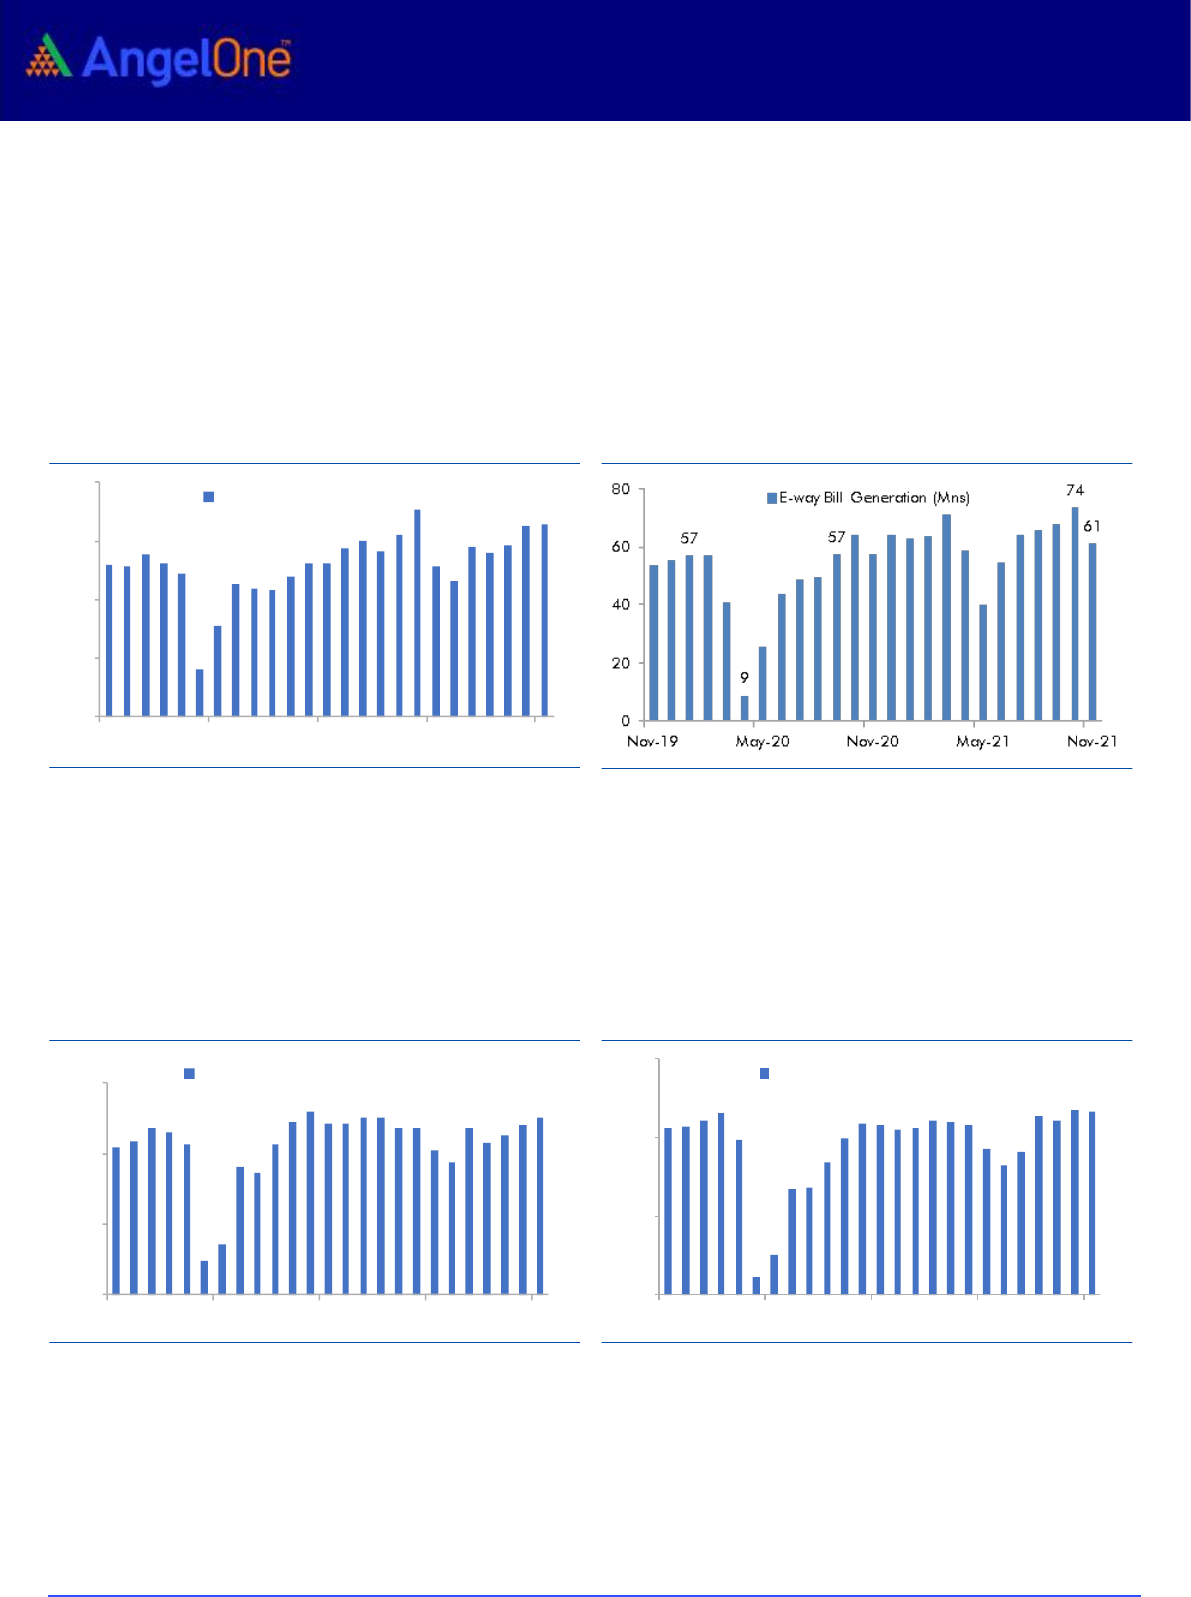
requirement for quarterly filings. E-way Bills generated too showed strong trends
before cooling off in November post the peak of the festive season. The data for
December till-date is encouraging, with numbers improving on a weekly average
basis against November 2021 indicating a pickup in economic activity.
Exhibit 1: GST Collections are trending higher
Source: Angel Research, Bloomberg, GoI
Exhibit 2: E-way Bill Generation also indicates pick-up
Source: Company, Angel Research, Bloomberg, GoI
As for the data from the IHS Markit survey, the manufacturing PMI hit a 10-month
high of 57.6 in Nov’21, pointing to a continued expansion in manufacturing
activities. Inflationary pressures are a cause of concern as they may impact
demand but factors like shipping rates and input prices like Crude, Coal, Iron Ore,
etc. have started to cool off post hitting their peaks during Sep-Oct 2021.
Exhibit 3: Manufacturing led initial recovery
Source: Angel Research, Bloomberg, IHS Markit
Exhibit 4: Services bounced back strongly in Q3FY22
Source: Angel Research, Bloomberg, IHS Markit
Services PMI which is expanding since Aug’21 came in at 58.1 for Nov’21 (58.4 for
Oct’21) which was the second fastest rise in business activity in nearly a decade.
The outlook remains optimistic but continued inflationary pressures may weigh
down on business confidence going ahead.
105
132
0
40
80
120
160
Nov/19
May/20
Nov/20
May/21
Nov/21
GST Collections (` Cr '000s)
55.3
56.3
48.1
57.6
20
35
50
65
Nov/19
May/20
Nov/20
May/21
Nov/21
IHS Markit India Manufacturing PMI
57.5
53.7
41.2
58.1
0
25
50
75
Nov/19
May/20
Nov/20
May/21
Nov/21
IHS Markit India Services PMI
Manufacturing has remained strong
and should carry the momentum in
CY2022
GST collection in Nov ’21 was as at
second highest levels ever since
introduction of GST
Services have rebounded strongly but
inflationary pressures may impacts
entiment
January 2022
4
Top Picks Report – January 2022
New Year Special
Tapering and Omicron have led to increased volatility in markets
The US Fed in its latest FOMC meeting has accelerated the timeline for tapering to
Mar’22 from Jun’22 and now expects at least three rate hikes by the end of 2022 as
compared to expectations of one rate hike in the Oct’21 meeting. The accelerated
tapering timeline by the US Fed combined with the rapid spread of the Omicron
strain in South Africa (RSA) towards the end of Nov’21 led to a sharp selloff in the
markets.
The Omicron strain has spread rapidly from South Africa to the rest of the world
with countries like the UK and the USA reporting a surge in new cases in the past
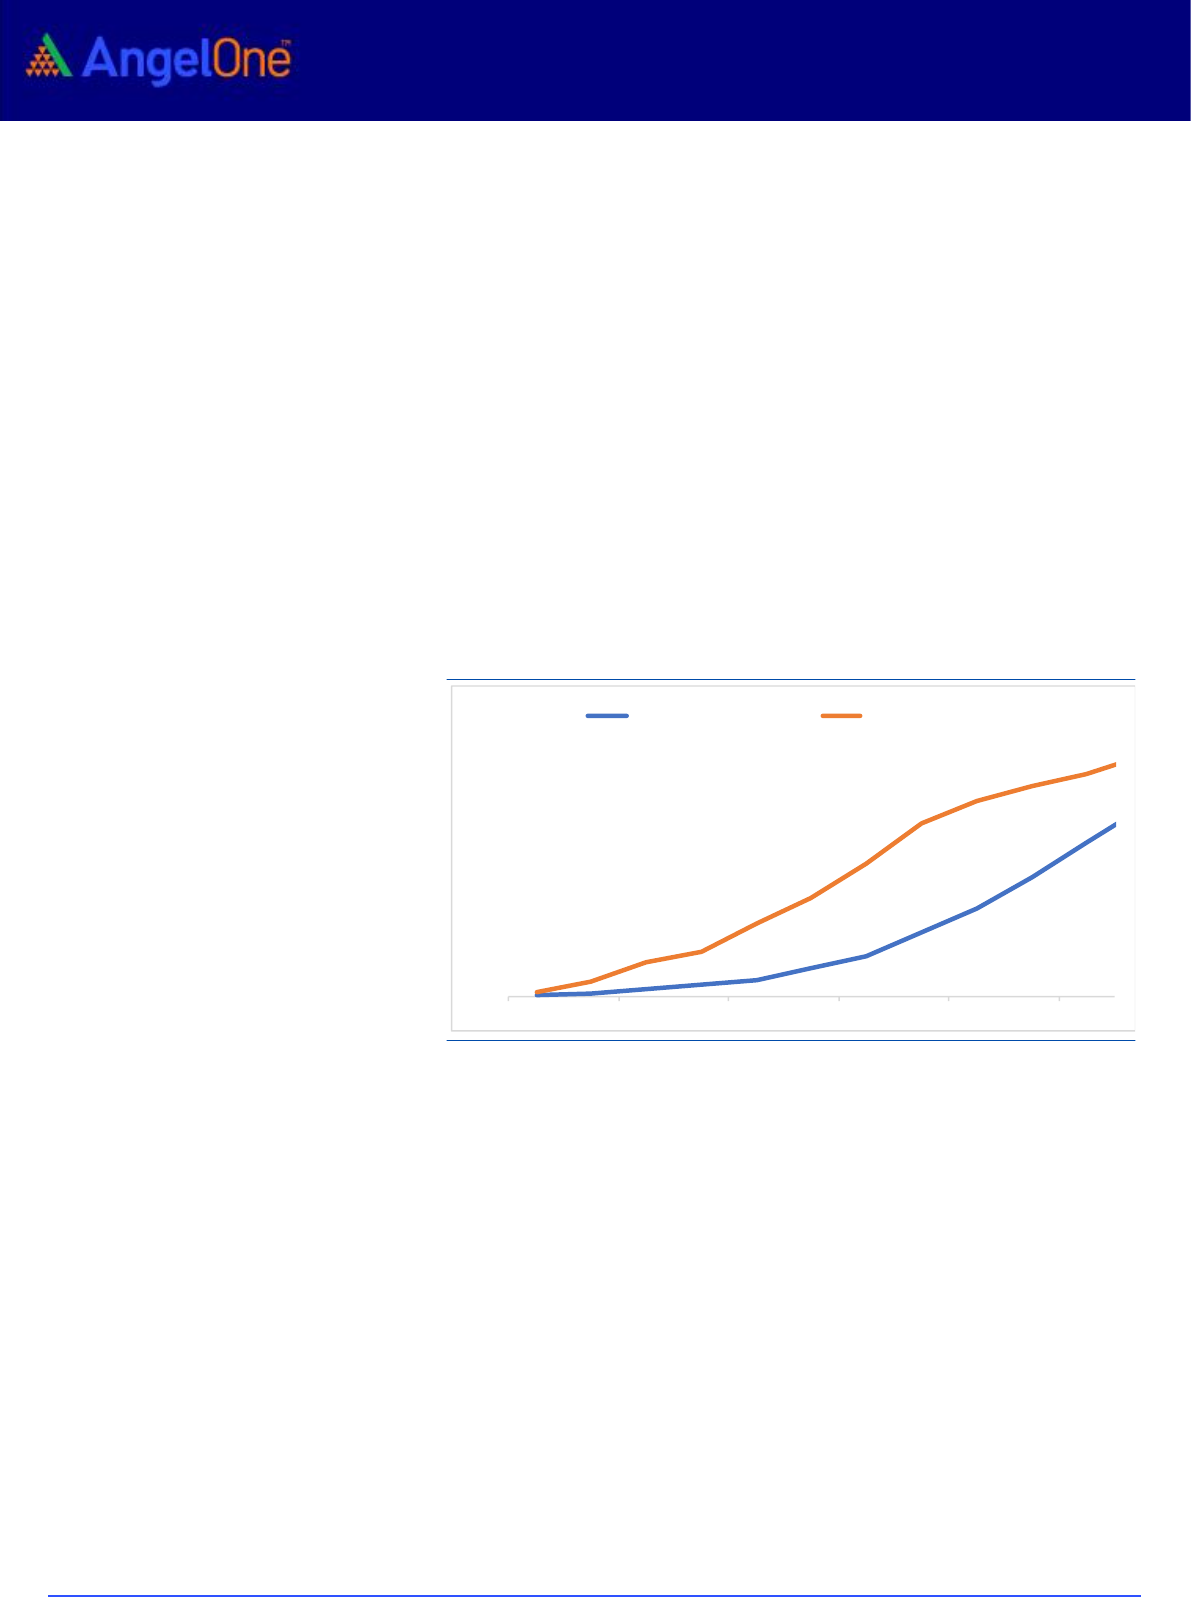
few weeks. While it is expected that the Omicron variant will spread in India, our
vaccination coverage has increased significantly over the past few months with
over 60%/41% of the total population being partially/fully vaccinated. Moreover,
anecdotal evidence suggests that though the Omicron strain is highly contagious it
does not cause serious illness like the Delta variant. Therefore we expect the
impact of Omicron variant should be transient and limited to 1QCY2022 given
increased vaccination coverage and low severity.
Exhibit 5: High vaccination rates should help going forward
Source: Government of India, Angel Research,
Market view and outlook
Given the aggressive tightening by the US Fed, there will be a slowdown in FII flows
next year though domestic flows should remain robust and make up for any
shortfall in FII flow. Nifty P/E based on consensus rolling one year forward
multiples have come down from ~23.0x to 20.7x, though it’s still at a 10% premium
to 5 year historical average of 18.6x. Given premium valuations and likely slowdown
in FII flows, we believe that we are unlikely to witness a broad-based rally like last
year, and hence bottom-up stock picking will be the key to generating alpha going
forward.
From a sector perspective, we are positive on Banking, and Consumer-facing
sectors given expectations of strong earnings growth in FY2023. We Also remain
positive on Chemicals and IT sector given high medium-term growth visibility for
both sectors. We are also positive on Building Materials and Real Estate Sectors
given low interest rates and the Government’s focus on housing & construction.
41.8%
60.7%
0%
20%
40%
60%
80%
Feb-21
Apr-21
Jun-21
Aug-21
Oct-21
Dec-21
Fully Vaccinated %
Part. Vaccinated %
We are positive on banking, building
material, chemicals, consumption, IT,
and real estate sector
US Fed has accelerated timelines for
tapering due to sustained high
inflation levels
Increased vaccination coverage
should provide fallout from possible
third wave

Angel Top Picks – Aug 2021
Please refer to important disclosures at the end of this report
5
New Year Picks
January 2022
6
Top Picks Report – January 2022
New Year Special
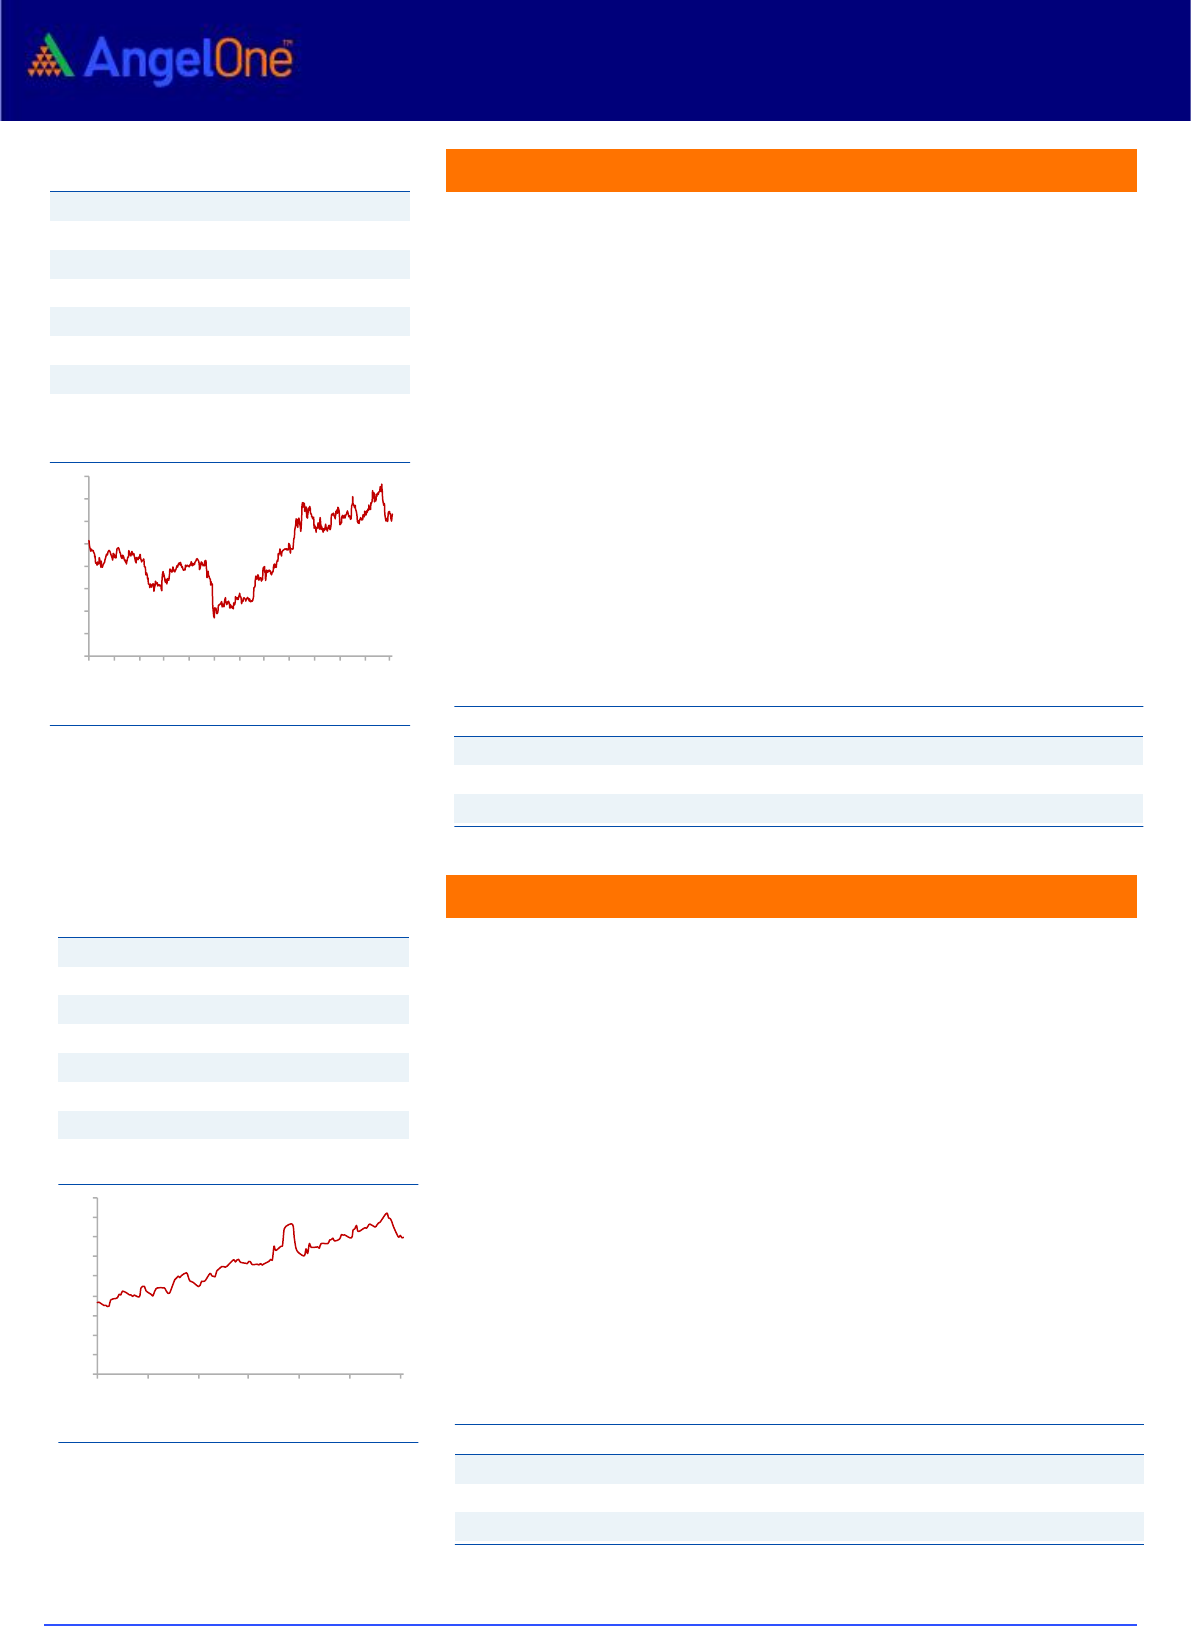
Federal Bank is one of India's largest old generation private sector banks. At
the end of H2FY2022 the bank had total assets of ₹2.06 lakh cr. with
deposits of ₹1.72 lakh cr. and a loan book of ₹1.34 lakh cr.
Federal Bank has posted a good set of numbers for Q2FY2022 as NII/
advances increased by 7.2%/9.5% YoY. Provisioning for the quarter was
down by 58.6% YoY because of which PAT was up by 49.6% YoY. GNPA and
NNPA ratio improved to 3.25% and 1.12% while restructuring went up by
~75bps qoq to 2.6% of advances.
Overall asset quality for the quarter improved in Q2FY2022, which was
better than our expectations. We expect asset quality to improve further in
H2FY2022 given continued opening up of the economy. We expect the
Federal bank to post NII/PPOP/PAT CAGR of 22.8%/23.7%/23.2% between
FY2020-23 and remain positive on the bank.
HDFC Bank
HDFC Bank is India's largest private sector bank with a loan book of ₹12 lakh
crore in H2FY2022 and deposit base of ₹14 lakh crore. The bank has a very
well spread-out book with wholesale constituting ~54% of the asset book
while retail accounted for the remaining 46% of the loan book.
Q2FY2022 numbers were better than expected as GNPA/ NNPA reduced by
12/8bps QoQ to 1.35% and 0.40% of advances. Restructured advances at the
end of the quarter stood at 1.5% of advances. The bank posted
NII/PPOP/PAT growth of 12.5%/14.4%/17.6% for the quarter on the back of
strong loan growth of 15.5% YoY. NIMs for the quarter were stable
sequentially at 4.1%.
The management has indicated that there will be maximum impact of 10-
20bps on asset quality from the restructured pool. Given the best in class
asset quality and expected rebound in growth from H2 FY2022 we are
positive on the bank given reasonable valuations at 2.9xFY23 adjusted book
which is at a discount to historical averages.
Stock Info
CMP
81
TP
135
Upside
66%
Sector
Banking
Market Cap (` cr)
17,079
Beta
1.4
52 Week High / Low
108/61
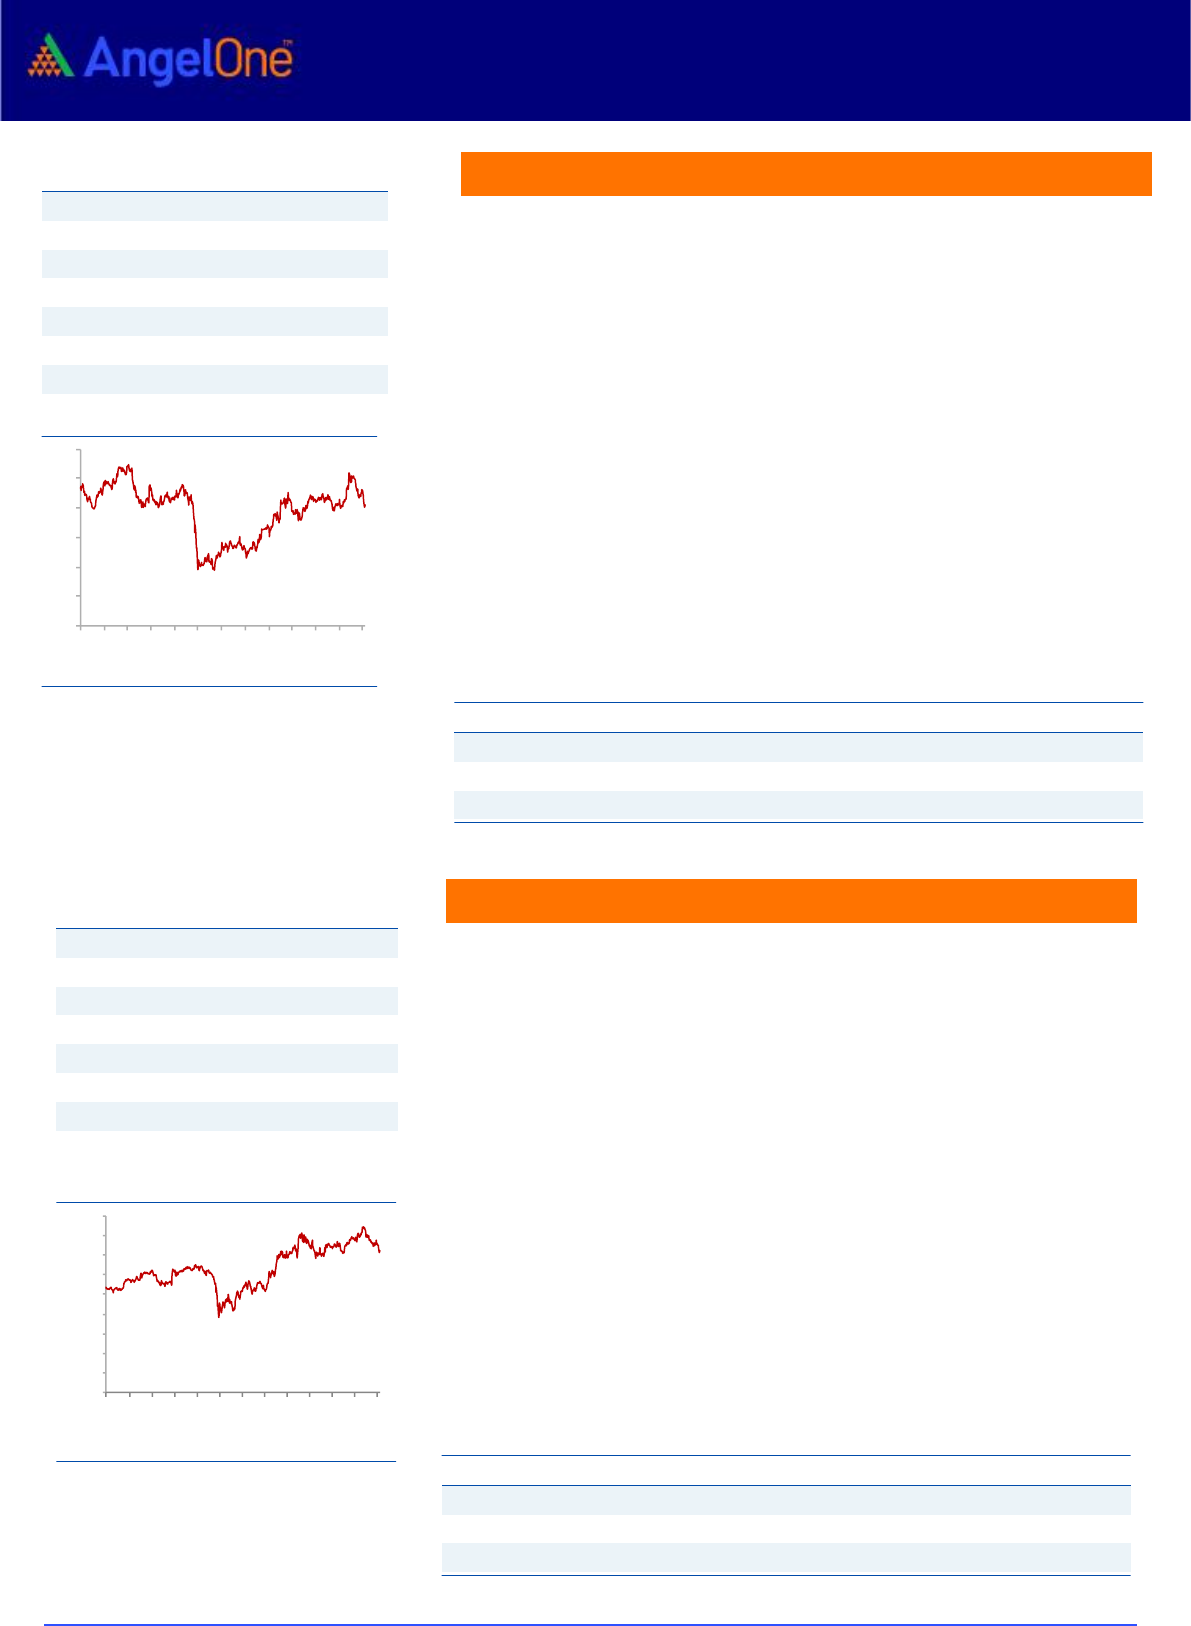
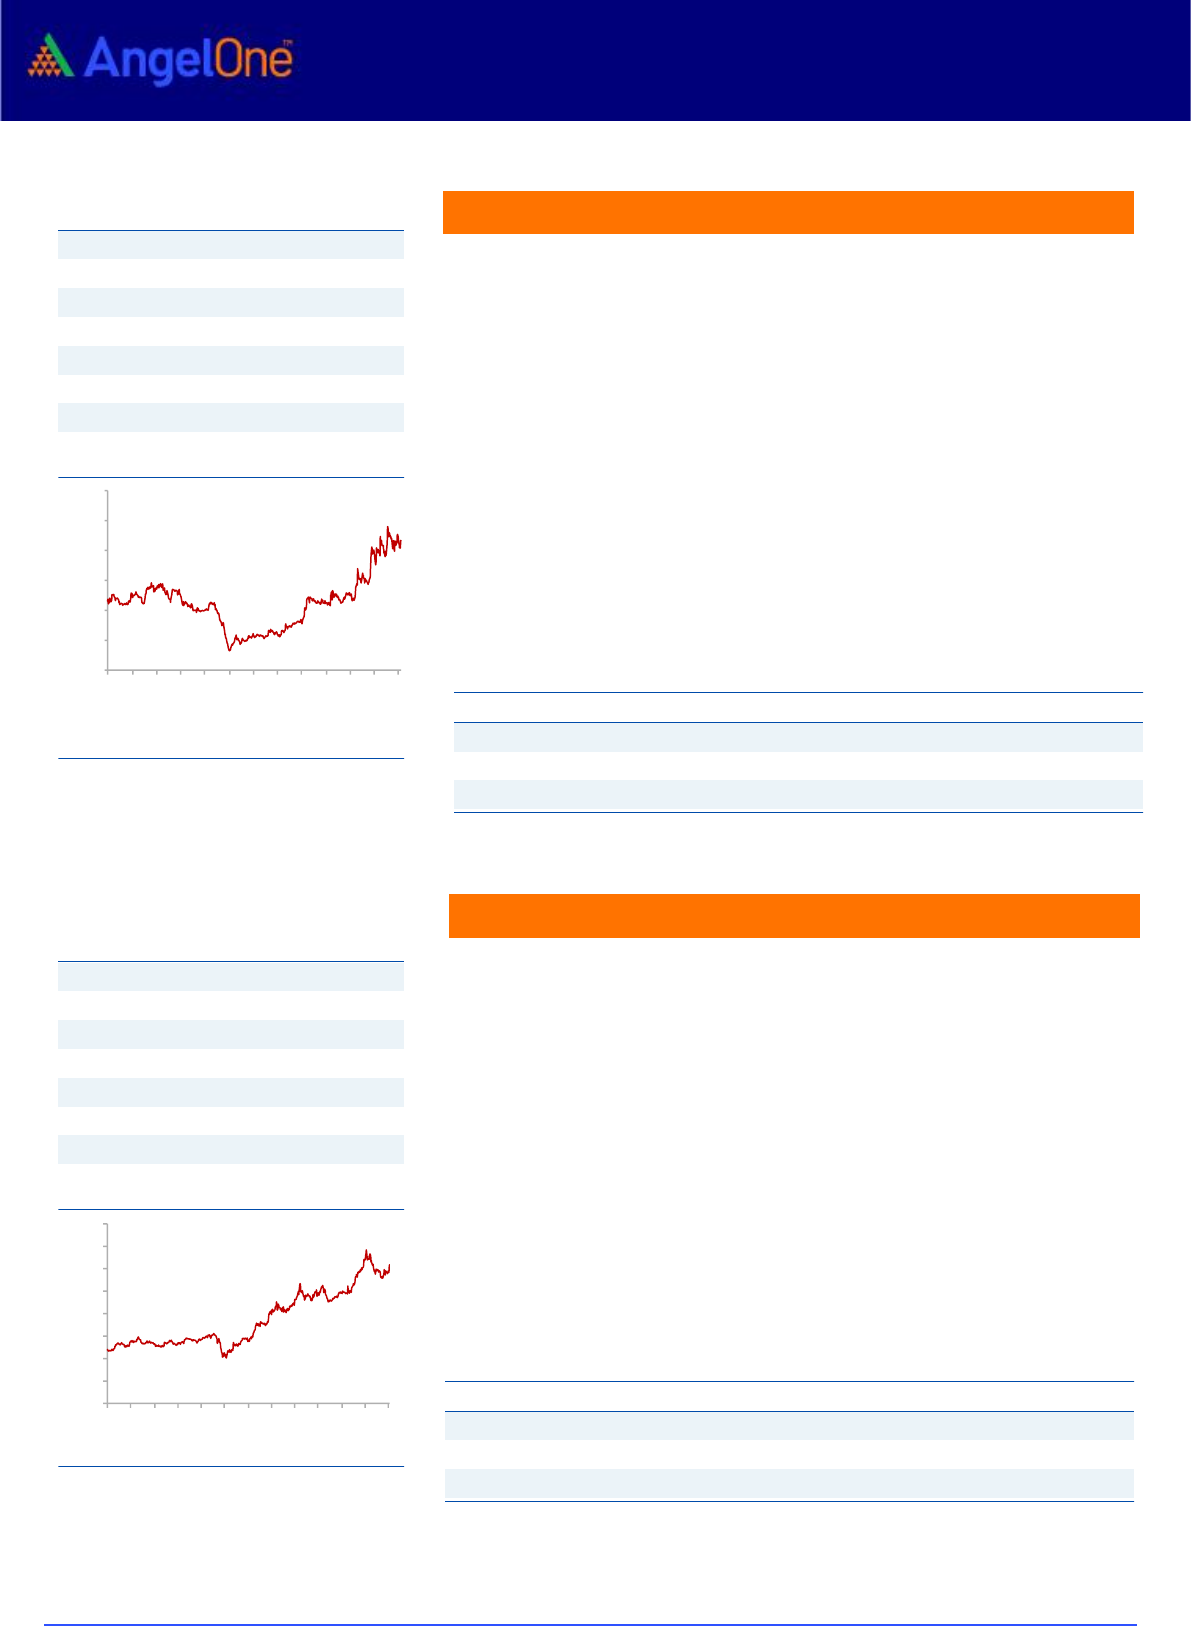
3-Year-Chart
-
20
40
60
80
100
120
Jan-19
Apr-19
Jun-19
Sep-19
Dec-19
Mar-20
Jun-20
Sep-20
Dec-20
Mar-21
Jun-21
Sep-21
Dec-21
Source: Company, Angel Research
Stock Info
CMP
1,450
TP
1,859
Upside
28%
Sector
Banking
Market Cap (` cr)
8,03,731
Beta
1.1
52 Week High / Low
1724/1342
3-Year-Chart
-
200
400
600
800
1,000
1,200
1,400
1,600
1,800
Jan-19
Apr-19
Jun-19
Sep-19
Dec-19
Mar-20
Jun-20
Sep-20
Dec-20
Mar-21
Jun-21
Sep-21
Dec-21
Source: Company, Angel Research
Federal Bank
Key Finances
Y/E
NII
NIM
PAT
EPS
ABV
ROA
ROE
P/E
P/ABV
March
(`cr)
(%)
(`cr)
(`)
(`)
(%)
(%)
(x)
(x)
FY2022E
6,472
3.0
2,094.6
10.0
83.9
1.0
11.9
8.2
1.0
FY2023E
8,562
3.4
3,409.8
16.2
99.1
1.4
16.5
5.1
0.8
Source: Company, Angel Research
HDFC Bank
Key Finances
Y/E
NII
NIM
PAT
EPS
ABV
ROA
ROE
P/E
P/ABV
March
(`cr)
(%)
(`cr)
(`)
(%)
(%)
(%)
(x)
(x)
FY2022E
74521
4.0
37667
68.0
416
2.0
17.5
21.2
3.5
FY2023E
88221
4.1
45076
81.4
496
2.1
17.7
17.7
2.9
Source: Company, Angel Research
January 2022
7
Top Picks Report – January 2022
New Year Special
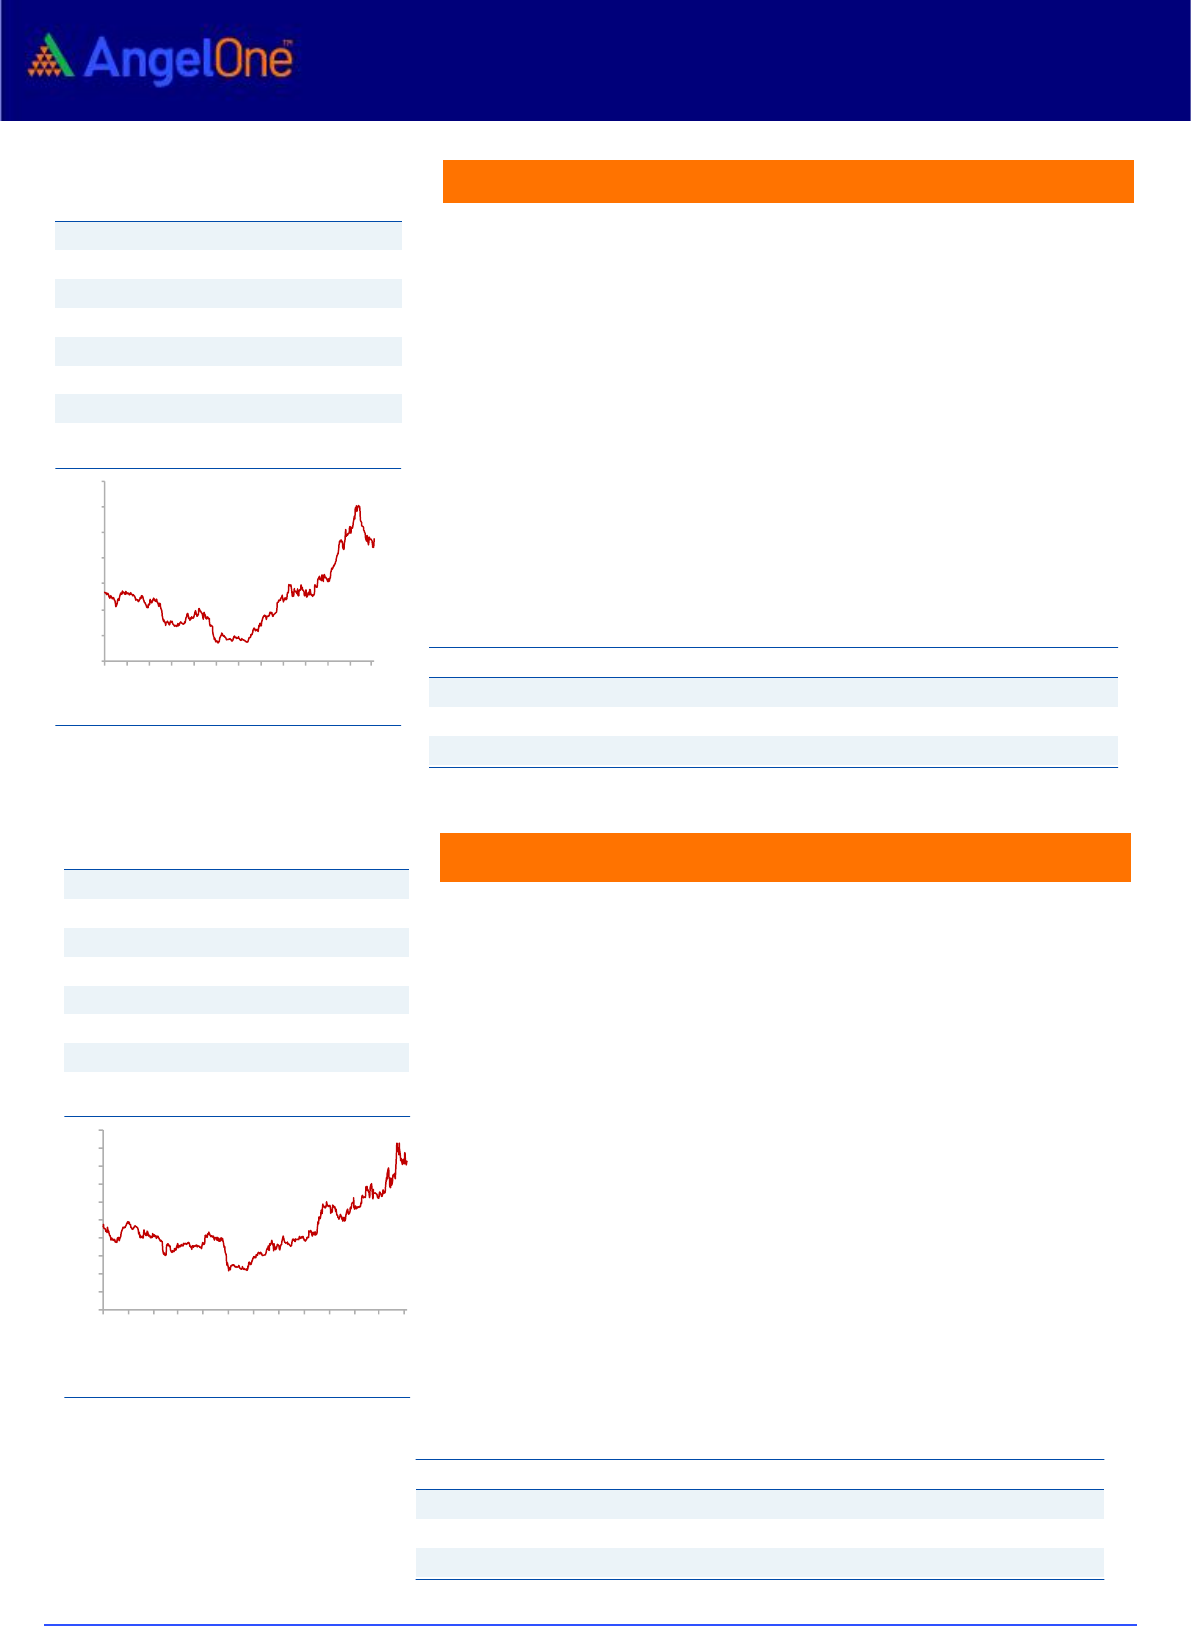
AU Small Finance Bank (AU SFB) is one of the leading Small Finance Banks with
AUM of ~₹34,688 Cr. at the end of Q1FY2022. It has a well-diversified
geographical presence across India. Wheels (auto) and SBL-MSME segments
account for 37% and 39% of the AUM respectively.
Q2FY2022 numbers were better than expected as GNPA/ NNPA reduced by
123/61bps QoQ to 3.16% and 1.65% of advances. Restructured advances at the
end of the quarter stood at 3.6% of advances. The bank posted NII growth of
34% for the quarter on the back of strong AUM growth of 24% YoY while NIMs
for the quarter stood at 6.0%
We expect AU SFB to post a robust NII/PPOP/ PAT CAGR of
21.7%/25.1%/26.4% between FY2020-23 on the back of AUM CAGR of 23.6%.
Reducing cost of funds will also help NIM expansion going forward. We believe
that the worst is over for the bank in terms of asset quality and expect
significant improvement in asset quality in H2FY2022 which should lead to a
rerating.
Key Finances
Y/E
NII
NIM
PAT
EPS
ABV
ROA
ROE
P/E
P/ABV
March
(`cr)
(%)
(`cr)
(`)
(`)
(%)
(%)
(x)
(x)
FY2022E
3052
5.4
1344
32.0
209.8
1.8
14.8
32.6
4.8
FY2023E
3899
5.6
1582
44.0
253.8
2.0
17.2
23.8
4.0
Source: Company, Angel Research
AU Small Finance
Stock Info
CMP
1,006
TP
1,520
Upside
51%
Sector
Banking
Market Cap (` cr)
31,573
Beta
1.5
52 Week High / Low
1389/841
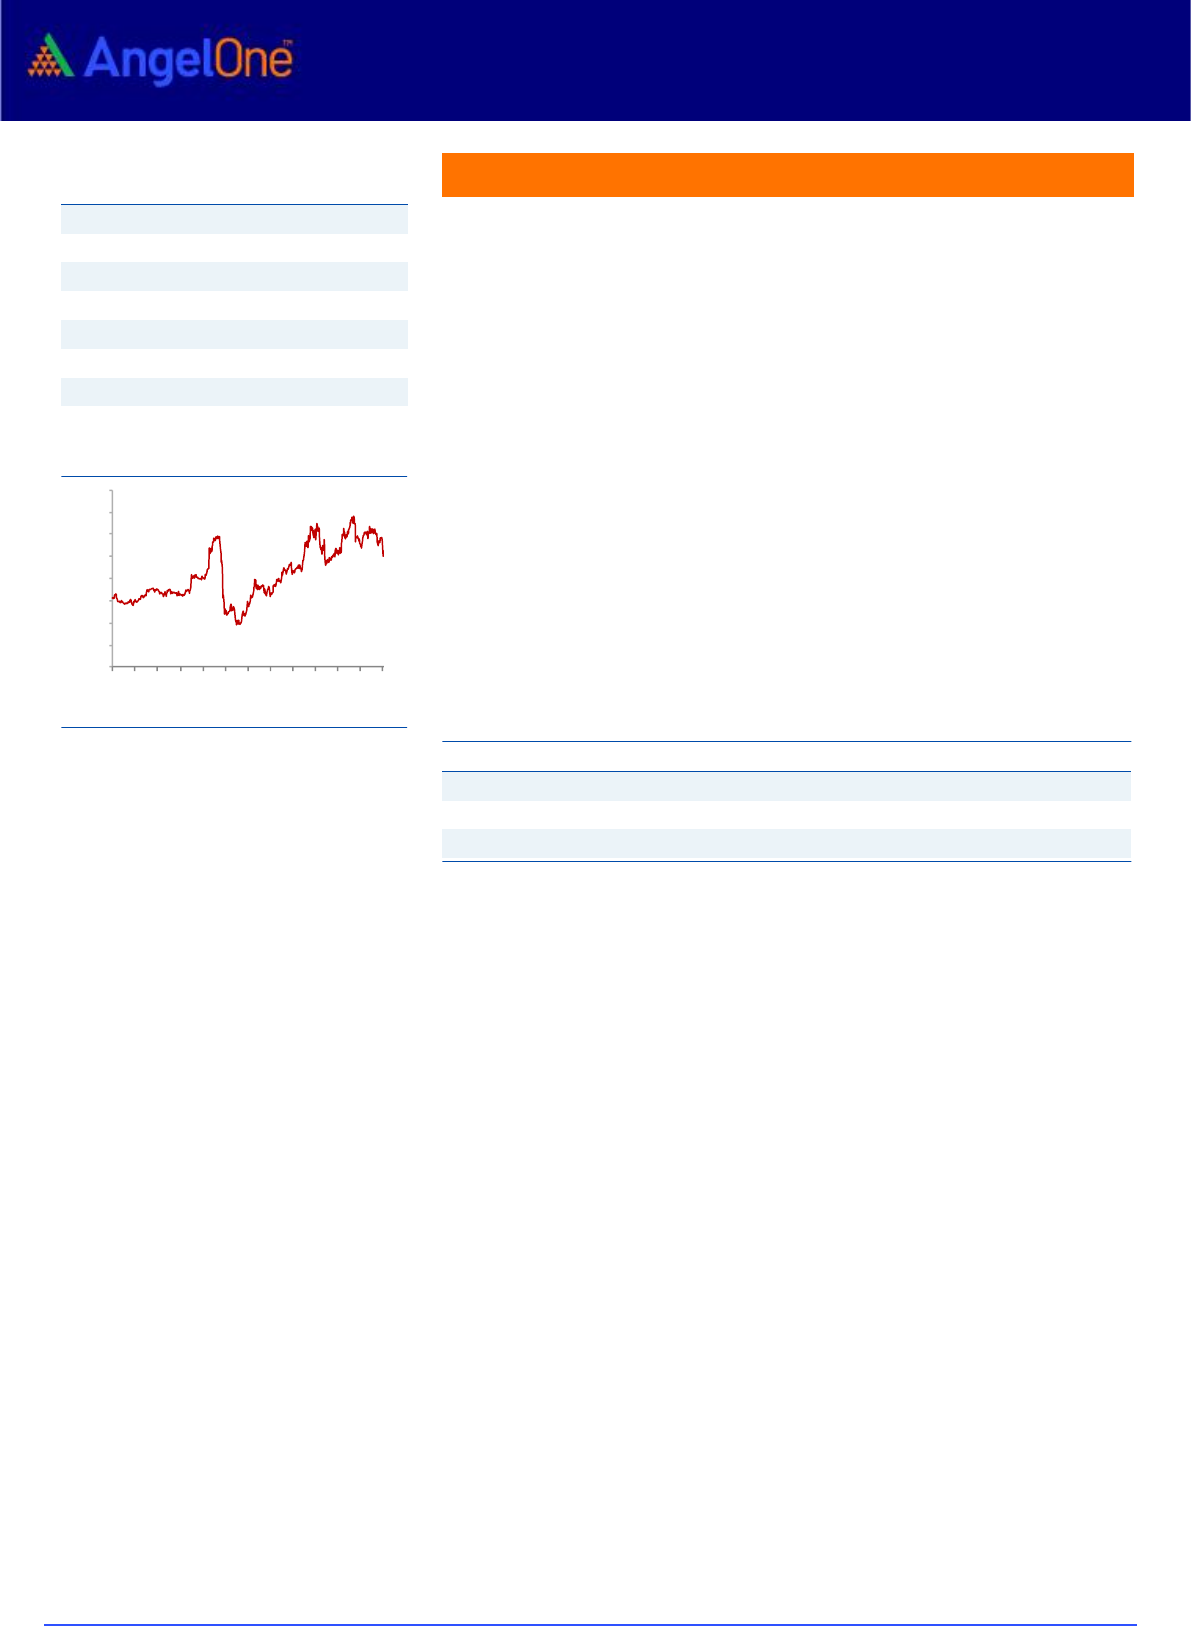
3-Year-Chart
-
200
400
600
800
1,000
1,200
1,400
1,600
Jan-19
Apr-19
Jun-19
Sep-19
Dec-19
Mar-20
Jun-20
Sep-20
Dec-20
Mar-21
Jun-21
Sep-21
Dec-21
Source: Company, Angel Research
January 2022
8
Top Picks Report – January 2022
New Year Special
The Ashok Leyland Ltd (ALL) is one of the leading players in the Indian CV
industry with a ~28% market share in the MHCV segment in FY21. The
company also has a presence in the fast-growing LCV segment where it is
witnessing marker share gains.
CV segment has held up well in the current year despite challenges.
Improvement in business sentiments along with spending on infrastructure
are likely to drive demand in the medium term. The bus segment is also
likely to bounce back going ahead with improvement in activities for the
end-users.
FY21 MHCV industry production volumes have been at the lowest levels seen
in ~12 years and we believe that the company is ideally placed to capture the
growth revival in the CV segment. We believe that ALL will be the biggest
beneficiary of the Government's voluntary scrappage policy and hence rate
the stock a BUY.
Sona BLW is one of India's leading automotive technology companies that
derives ~40% of its revenues from Battery Electric Vehicles (BEV) and
Hybrid Vehicles. It supplies EV differential assemblies and gears, BSG
systems, and EV traction motors to global customers. ~75% of their income
from the sale of goods in FY21 came from end-use in the overseas markets.
This global BEV segment has been fastest growing and is expected to
maintain high growth rates, which are positive for Sona BLW.
Sona BLW has a strong market share ranging from 55-90% for differential
gears for PV, CV, and tractor OEMs in India. The company's combined motor
and driveline capabilities have enabled them to gain market share across its
products especially for products related to EV/BEV.
Given the traction in the BEV/Hybrid Vehicle space, we believe that Sona
BLW will continue to command a higher multiple, which is justified by ~49%
earnings CAGR over FY21-24E.
Ashok Leyland
Key Finances
Y/E
Sales
OPM
PAT
EPS
ROE
P/E
P/BV
EV/Sales
March
(`cr)
(%)
(`cr)
(`)
(%)
(x)
(x)
(x)
FY2022E
21,316
7.0
353
1.2
4.8
104.8
4.8
1.8
FY2023E
30,241
10.5
1642
5.6
20.9
22.5
4.2
1.3
Source: Company, Angel Research
Sona BLW Precis.
Key Finances
Y/E
Sales
OPM
PAT
EPS
ROE
P/E
P/BV
EV/Sales
March
(`cr)
(%)
(`cr)
(`)
(%)
(x)
(x)
(x)
FY2022E
2,171
26.9
335
5.7
23.0
122.5
29.2
21.8
FY2023E
2,997
28.3
500
8.6
28.3
81.2
24.6
15.8
Source: Company, Angel Research
Stock Info
CMP
123
TP
175
Upside
42%
Sector
Auto
Market Cap (` cr)
36,063
Beta
1.5
52 Week High / Low
153/92
3-Year-Chart
-
20
40
60
80
100
120
140
160
Jan-19
Apr-19
Jun-19
Sep-19
Dec-19
Mar-20
Jun-20
Sep-20
Dec-20
Mar-21
Jun-21
Sep-21
Dec-21
Source: Company, Angel Research
Stock Info
CMP
706
TP
959
Upside
36%
Sector
Auto
Market Cap (` cr)
41,247
Beta
1.2
52 Week High / Low
839/295
7-Months-Chart
-
100
200
300
400
500
600
700
800
900
Jun-21
Jul-21
Aug-21
Sep-21
Oct-21
Nov-21
Dec-21
Source: Company, Angel Research
January 2022
9
Top Picks Report – January 2022
New Year Special
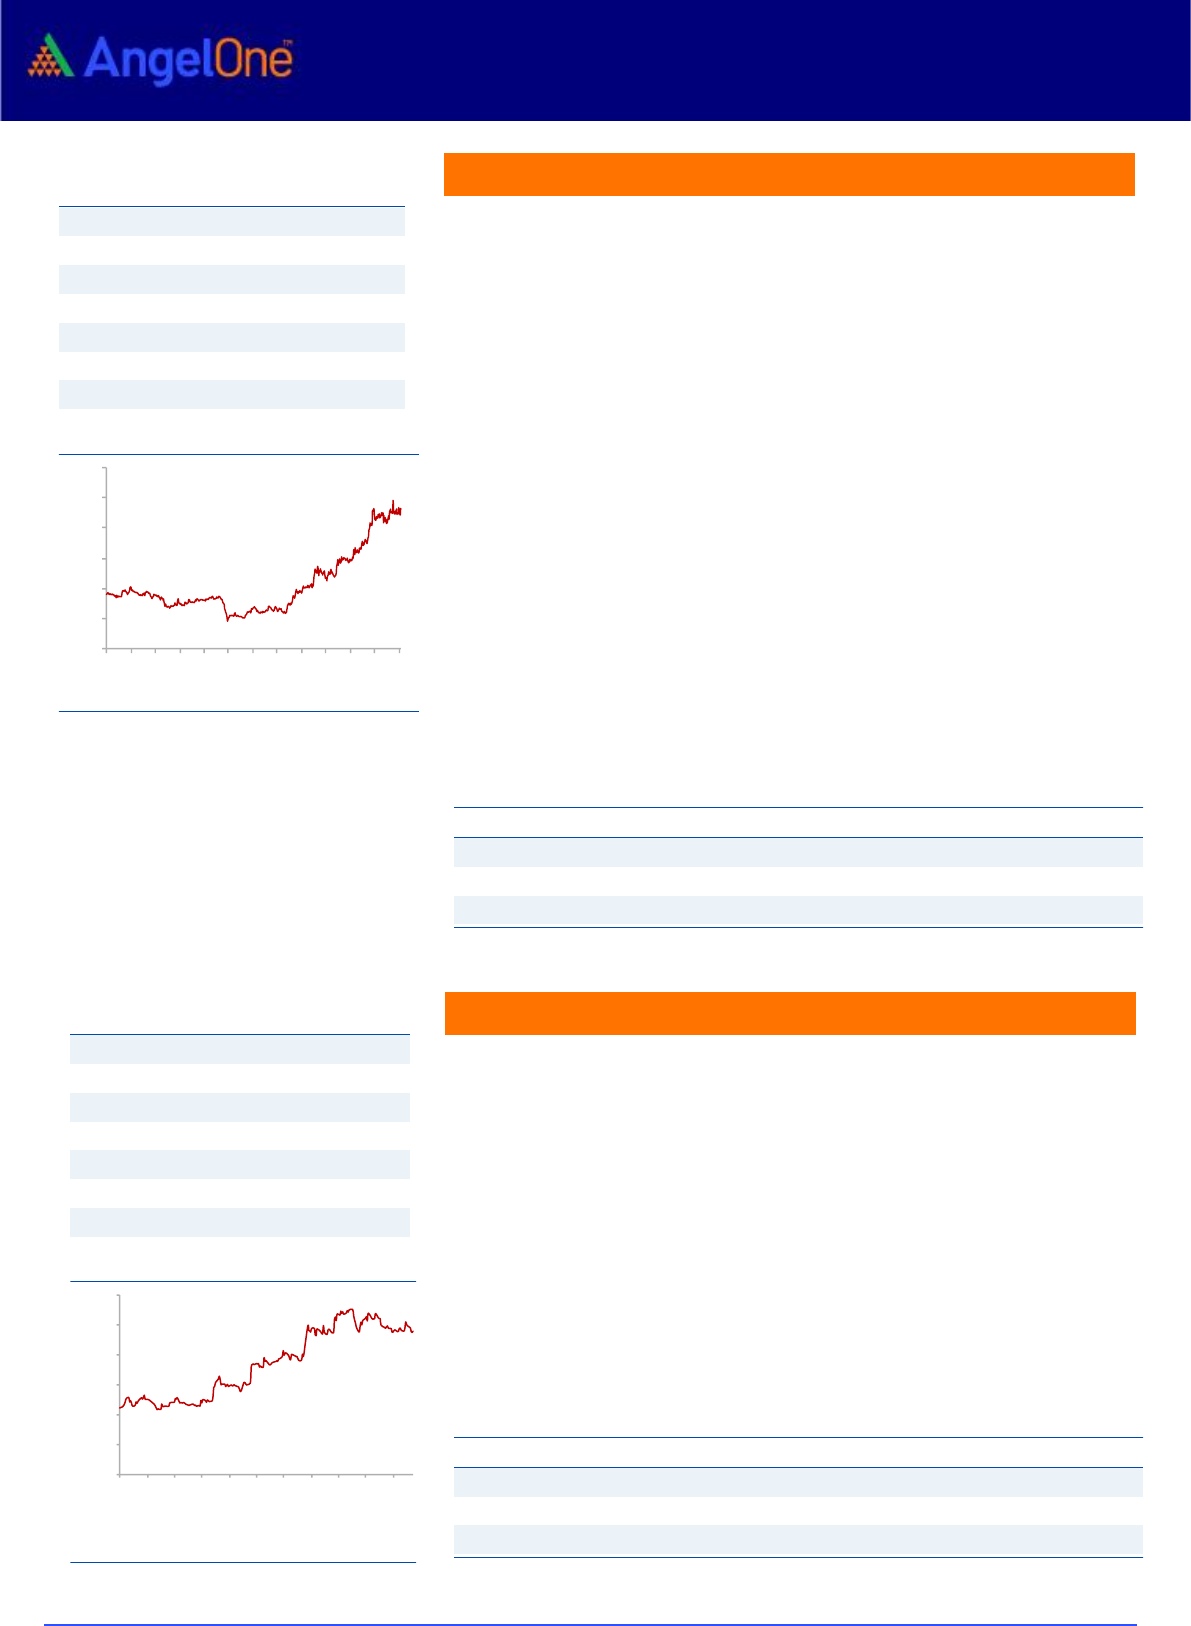
Ramkrishna Forgings (RKFL), a leading forging player in India and among a
select few having heavy press, stands to benefit from a favorable demand
outlook for the Medium & Heavy Commercial Vehicle (M&HCV) industry in
domestic and other key geographies in the near term.
The company has phased out its CAPEX over the past few years during
which it was impacted by industry slowdown in certain periods. With the
end to the CAPEX cycle, the favorable outlook in the medium term, and with
sufficient capacity in place, we believe RKFL volumes would be able to post
volume CAGR of 29% over FY21-23E.
RKFL has been able to add new products, which have higher value addition.
Better mix along with operating leverage is expected to result in ~550 YoY
bps EBITDA margin improvement in FY22E.
Suprajit Engineering (SEL), is the largest supplier of automotive cables to
the domestic OEMs with a presence across both 2Ws and PVs. Over the
years, SEL has evolved from a single product/client company in India to have
a diversified exposure which coupled with its proposition of low-cost player
has enabled it to gain market share and more business from existing
customers.
SEL has outperformed the Indian Auto industry in recent years (posting
positive growth vs low double-digit declines for the domestic 2W and PV
industry in FY21). The company believes that consolidation of vendors and
new client additions would help in maintaining the trend of market/wallet
share gains.
SEL has grown profitably over the years and as a result, it boasts a strong
balance sheet (net cash). We believe SEL is a prime beneficiary of a ramp-up
in production by OEMs across the globe and is well insulated from the threat
of EV (is developing new products). Its premium valuations are justified in
our opinion owing to its strong outlook and top-grade quality of earnings.
Ramkrishna Forg.
Key Finances
Y/E
Sales
OPM
PAT
EPS
ROE
P/E
P/BV
EV/Sales
March
(`cr)
(%)
(`cr)
(`)
(%)
(x)
(x)
(x)
FY2022E
2,213
23.5
216.0
63.4
19.5
15.0
3.5
2.0
FY2023E
2,595
23.9
293.0
83.0
21.5
11.5
2.8
1.6
Source: Company, Angel Research
Suprajit Engg.
Stock Info
CMP
935
TP
1,545
Upside
65%
Sector
Auto
Market Cap (` cr)
2,993
Beta
1.0
52 Week High / Low
1260/451
3-Year-Chart
-
200
400
600
800
1,000
1,200
1,400
Jan-19
Apr-19
Jun-19
Sep-19
Dec-19
Mar-20
Jun-20
Sep-20
Dec-20
Mar-21
Jun-21
Sep-21
Dec-21
Source: Company, Angel Research
Stock Info
CMP
420
TP
520
Upside
24%
Sector
Auto
Market Cap (` cr)
5,813
Beta
1.1
52 Week High / Low
475/190
3-Year-Chart
-
50
100
150
200
250
300
350
400
450
500
Jan-19
Apr-19
Jun-19
Sep-19
Dec-19
Mar-20
Jun-20
Sep-20
Dec-20
Mar-21
Jun-21
Sep-21
Dec-21
Source: Company, Angel Research
Key Finances
Y/E
Sales
OPM
PAT
EPS
ROE
P/E
P/BV
EV/Sales
March
(` cr)
(%)
(`cr)
(`)
(%)
(x)
(x)
(x)
FY2022E
1,969
14.8
168
12.2
16.2
33.5
5.3
3.2
FY2023E
2,916
15.3
268
19.3
22.9
21.2
4.6
2.1
Source: Company, Angel Research
January 2022
10
Top Picks Report – January 2022
New Year Special
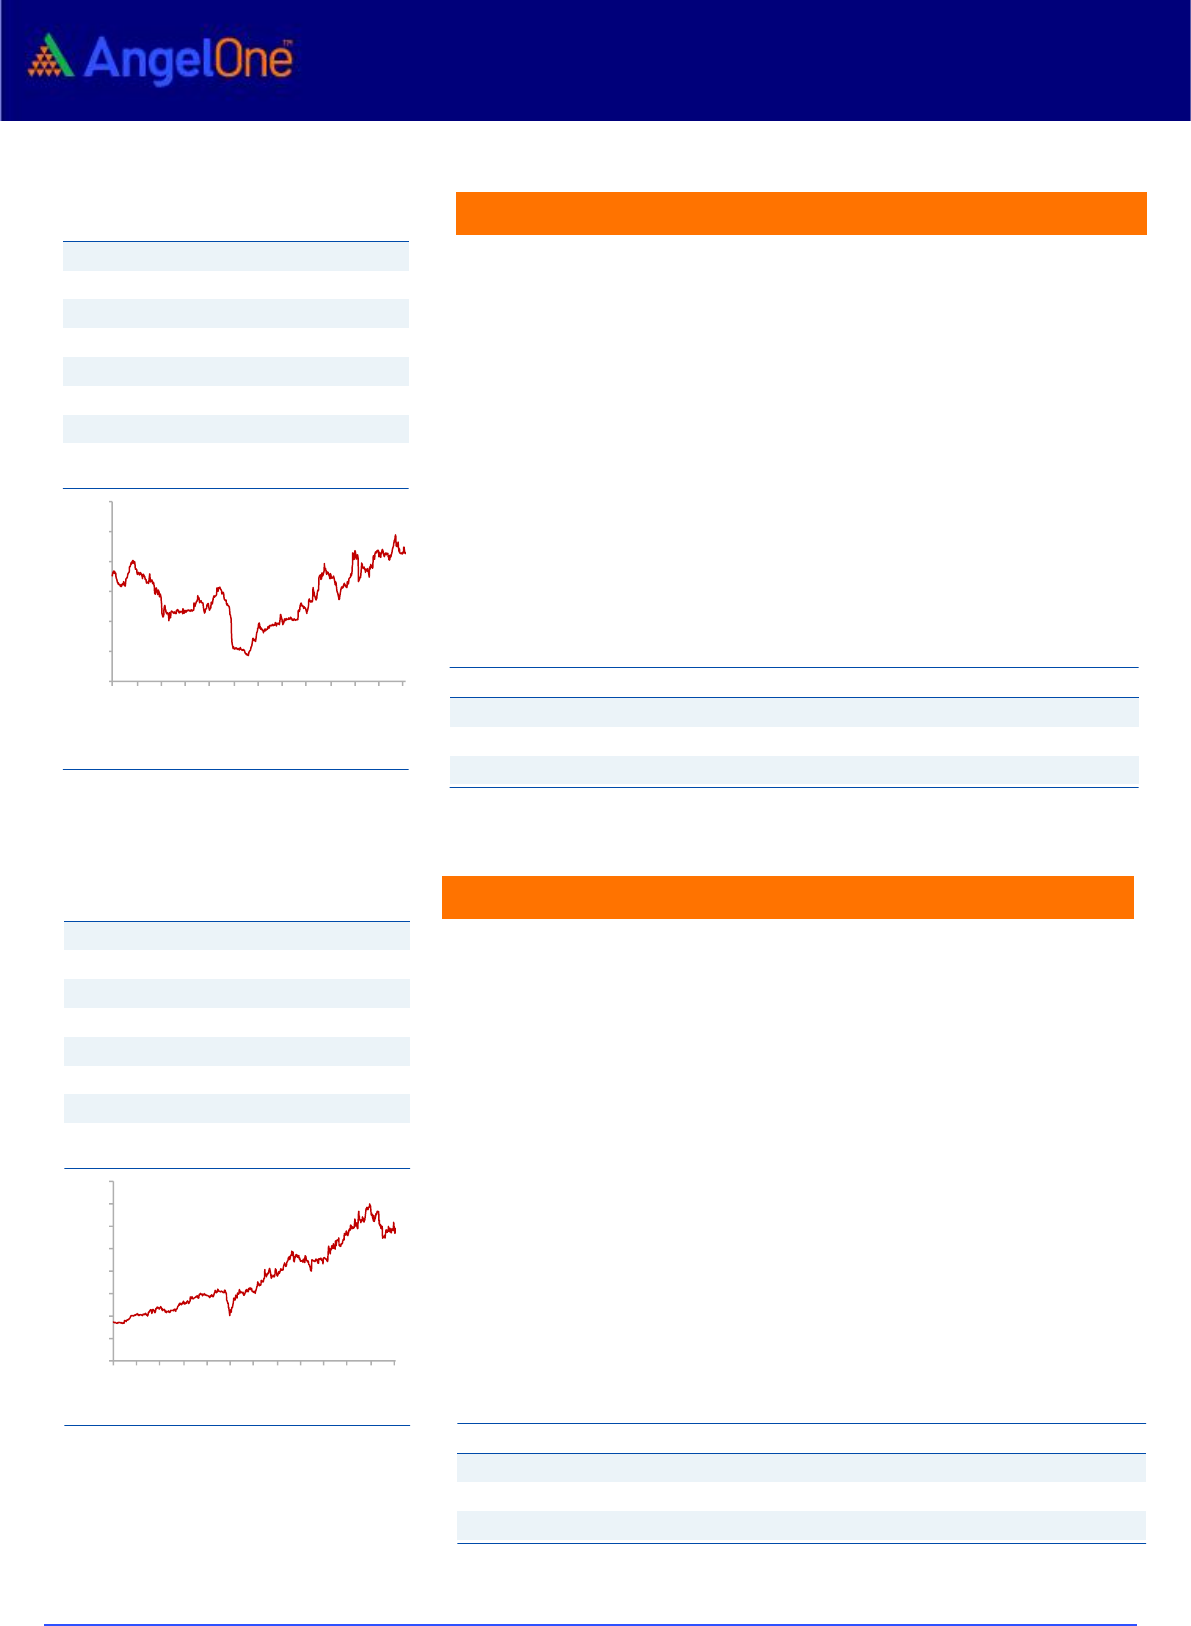
Carborundum Universal (CUMI) is a leading manufacturer of abrasives,
industrial ceramics, refractories, and electro minerals (EMD) in India having
application across diversified user industries. CUMI is expected to benefit
from improving demand scenarios across its end-user industries such as
auto, auto components, engineering, basic metals, infrastructure, and
power.
CUMI has shown good execution in recent quarters with a strong
performance in Abrasives and EMD segments. Within Abrasive, the company
is gaining market share (supply chain issues/preference for Indian suppliers)
and should benefit from a good end-user industry demand. EMD
performance is likely to sustain owing to strong pricing and volumes (due to
the China+1 strategy of its customers).
Overseas operations have also improved and operations are expected to be
at normal levels. We believe that CUMI’s leadership position in the domestic
abrasives market, well-diversified presence, launches of value-added
products, and healthy cost advantages would sustain the improvement in
profitability and enhance cash generation.
Stove Kraft Ltd (SKL) is engaged in the business of manufacturing and
selling Kitchen and Home appliances products like pressure cookers, LPG
stoves, non-stick cookware, etc. under the brand names 'Pigeon' and 'Gilma'.
In the Pressure Cookers and Cookware segment, over the last two years, the
company has outperformed the industry and its peers. Post-Covid,
organized players are gaining market share from unorganized players which
would benefit the player like SKL.
Going forward, we expect SKL to report healthy top-line & bottom-line
growth on the back of new product launches, a strong brand name, and wide
distribution network.
Carborundum Universe
Key Finances
Y/E
Sales
OPM
PAT
EPS
ROE
P/E
P/BV
EV/Sales
March
(` cr)
(%)
(` cr)
(`)
(%)
(x)
(x)
(x)
FY2022E
3,247
19.5
432
22.8
18.6
40.5
6.8
5.0
FY2023E
3,851
19.2
516
27.2
19.0
33.9
5.8
4.1
Source: Company, Angel Research
Key Finances
Y/E
Sales
OPM
PAT
EPS
ROE
P/E
P/BV
EV/Sales
March
(` cr)
(%)
(`cr)
(`)
(%)
(x)
(x)
(x)
FY2022E
1160.2
10.8
75.3
23.1
20.0
41.3
8.3
4.7
FY2023E
1369.0
11.7
105.3
32.3
21.8
29.5
6.5
3.5
Source: Company, Angel Research
Stock Info
CMP
921
TP
1,100
Upside
19%
Sector
Others
Market Cap (` cr)
17,485
Beta
0.7
52 Week High / Low
1008/368
3-Year-Chart
-
200
400
600
800
1,000
1,200
Jan-19
Apr-19
Jun-19
Sep-19
Dec-19
Mar-20
Jun-20
Sep-20
Dec-20
Mar-21
Jun-21
Sep-21
Dec-21
Source: Company, Angel Research
Stove Kraft
Stock Info
CMP
957
TP
1,288
Upside
35%
Sector
Others
Market Cap (` cr)
3,134
Beta
1.0
52 Week High / Low
1135/400
11-Months-Chart
-
200
400
600
800
1,000
1,200
Feb-21
Mar-21
Apr-21
May-21
Jun-21
Jul-21
Aug-21
Sep-21
Oct-21
Nov-21
Dec-21
Source: Company, Angel Research
January 2022
11
Top Picks Report – January 2022
New Year Special
Safari Industries (India) Ltd (SIIL) is amongst the leading luggage players
with a market share of ~18% market share in the organized sector. Being a
market leader in the mass segment as well as a shift from unorganized to
organized sectors would benefit SIIL.
Over the last three years, the company has outperformed luggage Industries
in terms of sales growth. The company has a wide distribution network
which would support growth going ahead. Focused product strategy and
diversified product portfolio are likely to boost growth.
Going forward, we expect SIIL to report strong top-line and bottom-line
growth on the back of strong growth in the organized sector, wide
distribution network, strong brand and promoter initiatives.
PI Industries is a leading player in providing Custom Synthesis and
Manufacturing Solutions (CSM) to global Agrochemical players. The CSM
business accounted for over 70% of the company's revenues in FY21 and is
expected to be the key growth driver for the company in the future.
The company has been increasing its share of high-margin CSM business
driven by strong relationship with global agrochemical players. PI is
leveraging its chemistry skill sets and is looking to diversify its CSM portfolio
to Electronic Chemicals, Pharma API, Fluoro Chemicals, etc. which will help
drive business.
We expect PI Industries to post Revenue/PAT CAGR of 20.0%/22.5%
between FY21-FY24 driven by 20% growth in the CSM business over the next
2-3 years. Moreover, foray into new segments like Electronic Chemicals and
APIs will also help drive growth over the next 3-4 years for the company.
Safari Inds.
Key Finances
Y/E
Sales
OPM
PAT
EPS
ROE
P/E
P/BV
EV/Sales
March
(`cr)
(%)
(` cr)
(`)
(%)
(x)
(x)
(x)
FY2022E
652.0
8.5
27.0
11.9
13.2
71.4
9.5
3.1
FY2023E
1024.0
10.3
63.0
28.3
24.4
30.0
7.4
2.0
Source: Company, Angel Research
P I Industries
Key Finances
Y/E
Sales
OPM
PAT
EPS
ROE
P/E
P/BV
EV/Sales
March
(`cr)
(%)
(`cr)
(`)
(%)
(x)
(x)
(x)
FY2022E
5602.9
23.0
932.4
61.3
15.1
47.9
3.6
7.4
FY2023E
6695.9
23.3
1133.7
74.6
15.8
39.4
3.1
6.1
Source: Company, Angel Research
Stock Info
CMP
869
TP
1,126
Upside
30%
Sector
Others
Market Cap (` cr)
1,946
Beta
0.6
52 Week High / Low
985/503
3-Year-Chart
-
200
400
600
800
1,000
1,200
Jan-19
Apr-19
Jun-19
Sep-19
Dec-19
Mar-20
Jun-20
Sep-20
Dec-20
Mar-21
Jun-21
Sep-21
Dec-21
Source: Company, Angel Research
Stock Info
CMP
2,892
TP
3,440
Upside
19%
Sector
Chemical
Market Cap (` cr)
43,873
Beta
0.8
52 Week High / Low
3533/1982
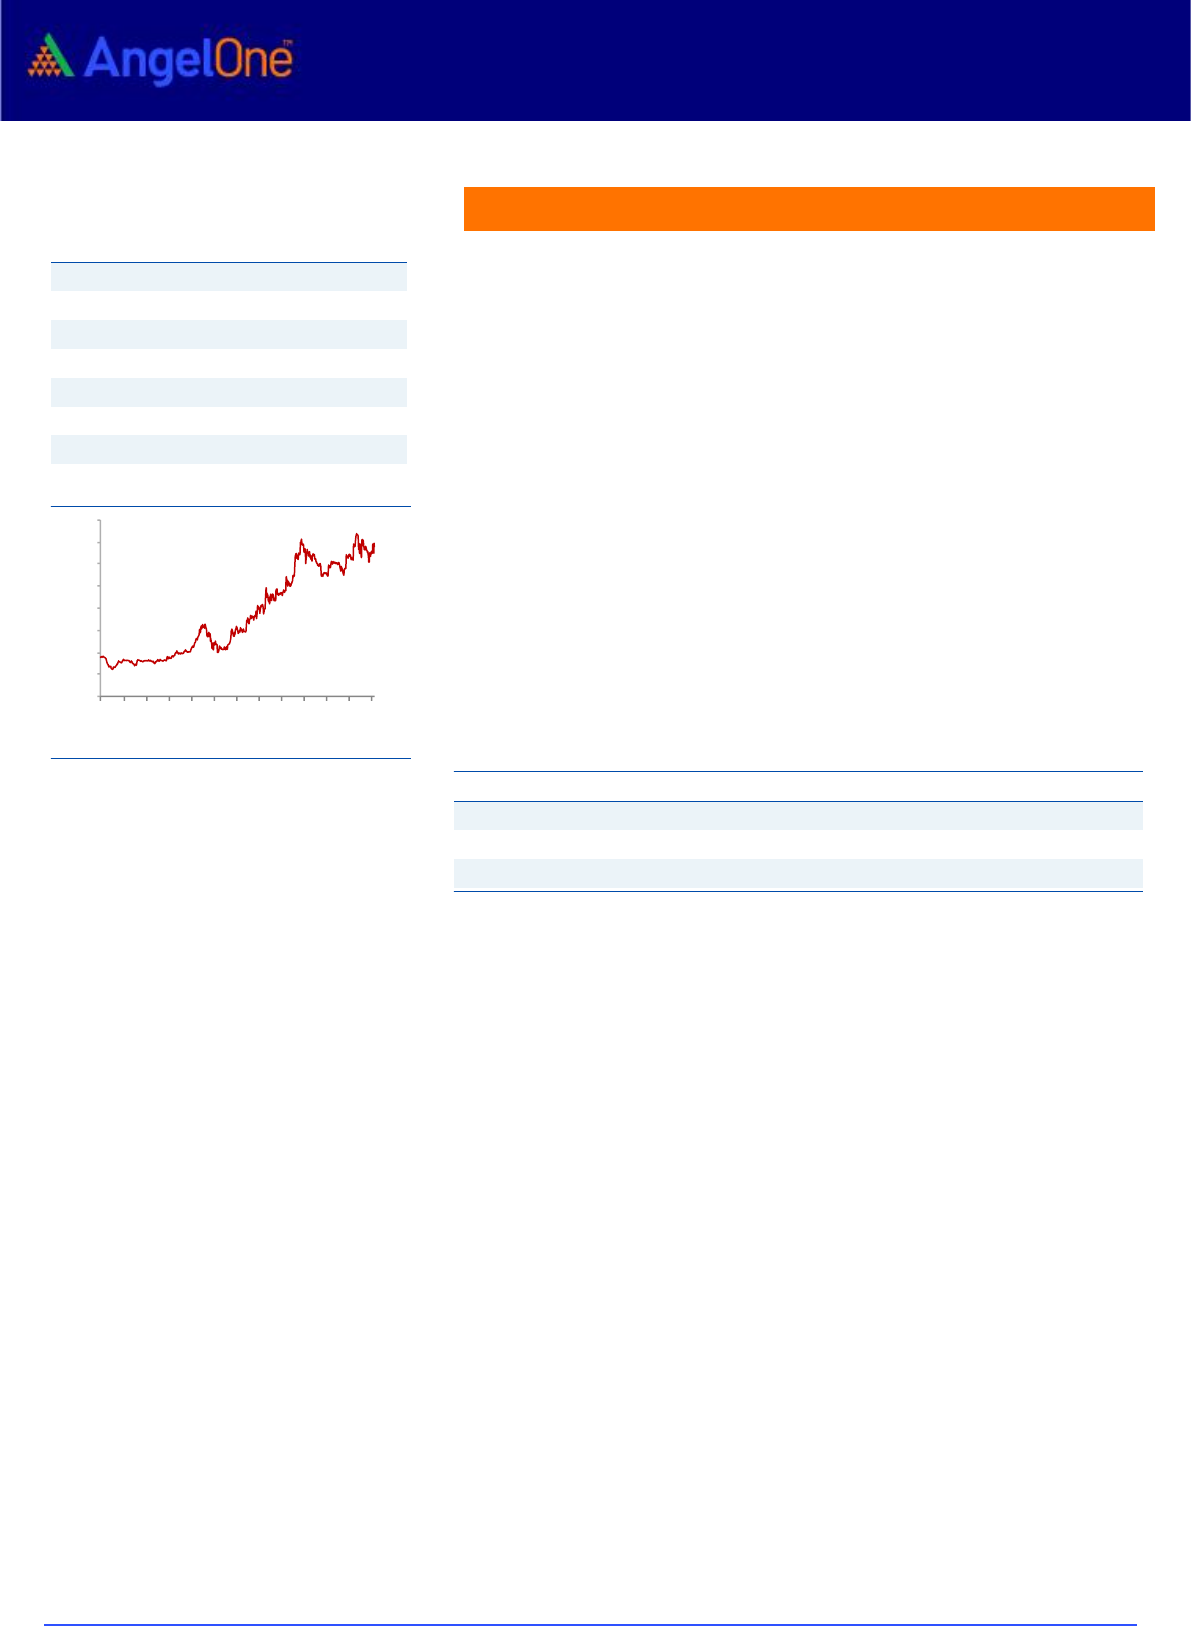
3-Year-Chart
-
500
1,000
1,500
2,000
2,500
3,000
3,500
4,000
Jan-19
Apr-19
Jun-19
Sep-19
Dec-19
Mar-20
Jun-20
Sep-20
Dec-20
Mar-21
Jun-21
Sep-21
Dec-21
Source: Company, Angel Research
January 2022
12
Top Picks Report – January 2022
New Year Special
The company operates in Residential and Commercial real-estate along with
Contractual business. 70% of residential pre-sales for Sobha comes from
the Bangalore market which is the main IT hub in India and we expect new
hiring by the IT industry will increase residential demand in the South India
market.
Ready to move inventory and under construction inventory levels have
moved down to their lowest levels. Customers are now having a preference
towards branded players like Sobha Developers.
The company expects to launch 17 new projects/phases spread over
12.56mn sqft across various geographies. The majority of launches will be
coming from the existing land bank of approximately. 200mn Sqft of salable
area.
HCL Tech (HCLT) is amongst the top four IT services companies based out of
India and provides a vast gamut of services like ADM, Enterprise Solutions,
Infrastructure Management Services etc.
IT Services witnessed robust growth of 5.2% QoQ CC in Q2FY22. New deal
TCV at USD 2.3bn was up by 38% YoY and included 4 large deals. Strong deal
wins will help drive growth in the services business which should make up
for any shortfall in the product business due to the delays in deal signing.
At CMP the stock is trading at a significant discount to the other large-cap IT
companies like Infosys and TCS and offers tremendous value at current
levels given market leader status in Infrastructure Management Services.
Sobha
Key Finances
Y/E
Sales
OPM
PAT
EPS
ROE
P/E
P/BV
EV/Sales
March
(`cr)
(%)
(`cr)
(`)
(%)
(x)
(x)
(x)
FY2022E
2706.2
0.6
201.0
21.2
7.8%
40.4
3.1
2.8
FY2023E
3597.5
0.6
749.0
79.0
23.1%
10.9
2.5
2.1
Source: Company, Angel Research
HCL Technologies
Key Finances
Y/E
Sales
OPM
PAT
EPS
ROE
P/E
P/BV
EV/Sales
March
(`cr)
(%)
(`cr)
(`)
(%)
(x)
(x)
(x)
FY2022E
84,844
19.3
13,234
48.1
19.0
25.5
10.0
3.8
FY2023E
97,991
19.4
15,007
54.5
19.0
22.5
8.8
3.2
Source: Company, Angel Research
Stock Info
CMP
864
TP
1,050
Upside
22%
Sector
Others
Market Cap (` cr)
8,194
Beta
1.3
52 Week High / Low
977/320
3-Year-Chart
-
200
400
600
800
1,000
1,200
Jan-19
Apr-19
Jun-19
Sep-19
Dec-19
Mar-20
Jun-20
Sep-20
Dec-20
Mar-21
Jun-21
Sep-21
Dec-21
Source: Company, Angel Research
Stock Info
CMP
1,267
TP
1,363
Upside
8%
Sector
IT
Market Cap (` cr)
3,43,740
Beta
0.8
52 Week High / Low
1377/890
3-Year-Chart
-
200
400
600
800
1,000
1,200
1,400
1,600
Jan-19
Apr-19
Jun-19
Sep-19
Dec-19
Mar-20
Jun-20
Sep-20
Dec-20
Mar-21
Jun-21
Sep-21
Dec-21
Source: Company, Angel Research
January 2022
13
Top Picks Report – January 2022
New Year Special
Amber Enterprises India Ltd. (Amber) is the market leader in the Room Air
Conditioners (RAC) outsourced manufacturing space in India. Amber would
outperform the industry due to its dominant position as a Room AC contract
manufacturer, increase in the share of business in existing customers as
well as new client additions.
Amber plans to increase revenues from components (by increasing product
offerings, catering to newer geographies, adding new clients) and exports
(already started in the Middle east). In the past 2-3 years, Amber has
acquired companies like IL JIN Electronics, Ever and Sidwal Refrigeration
Industries, which would help in backward integration and also help the
company to foray into different segments like railway, metro, and defense.
Going forward, we expect the company to witness healthy profitability on
the back of foray into the Commercial AC segment, entry into export
markets, and participation in the PLI scheme.
Amber Enterp.
Key Finances
Y/E
Sales
OPM
PAT
EPS
ROE
P/E
P/BV
EV/Sales
March
(`cr)
(%)
(`cr)
(`)
(%)
(x)
(x)
(x)
FY2022E
4004.0
7.1
150.4
45.4
8.6
74.7
6.3
2.7
FY2023E
5620.0
8.6
262.7
78.9
13.1
43.0
5.5
2.0
Source: Company, Angel Research
Stock Info
CMP
3,332
TP
4,150
Upside
25%
Sector
Others
Market Cap (` cr)
11,225
Beta
0.5
52 Week High / Low
3788/2287
3-Year-Chart
-
500
1,000
1,500
2,000
2,500
3,000
3,500
4,000
Jan-19
Apr-19
Jun-19
Sep-19
Dec-19
Mar-20
Jun-20
Sep-20
Dec-20
Mar-21
Jun-21
Sep-21
Dec-21
Source: Company, Angel Research

January 2022
14
Top Picks Report – January 2022
New Year Special
Stock sold in last 6 Month
Stock
Date
Reco
Price
Quess Corp
15-Jul-21
EXIT
751
Apollo Hospitals
27-Jul-21
EXIT
4,100
IDFC First Bank
5-Aug-21
EXIT
47
Galaxy Surfact.
18-Aug-21
EXIT
2,997
Jindal Steel
23-Aug-21
EXIT
362
Godrej Propert.
25-Aug-21
EXIT
1,437
Escorts
31-Aug-21
EXIT
1,348
Sobha
7-Sep-21
EXIT
780
Crompton Gr. Con
14-Sep-21
EXIT
484.00
Dalmia BharatLtd
22-Sep-21
EXIT
2,143
Bajaj Electrical
24-Sep-21
EXIT
1,499
L & T Infotech
27-Sep-21
EXIT
5,950
GNA Axles
19-Oct-21
EXIT
1,076
Whirlpool India
3-Nov-21
EXIT
2,074
Shri.City Union.
6-Dec-21
EXIT
2,066
Lemon Tree Hotel
17-Dec-21
EXIT
47.25
Source: Company, Angel Research
Stock bought in Last 6 Month
Stock
Date
Reco
Price
Galaxy Surfact.
7-Jul-21
BUY
3,135
AU Small Finance
9-Jul-21
BUY
1,148
Dalmia BharatLtd
15-Jul-21
BUY
2,218
Safari Inds.
19-Jul-21
BUY
742
HDFC Bank
5-Aug-21
BUY
1,490
Sona BLW Precis.
25-Aug-21
BUY
484
Bajaj Electrical
27-Aug-21
BUY
1,189
Sobha
31-Aug-21
BUY
627
P I Industries
9-Sep-21
BUY
3,420
Amber Enterp.
14-Sep-21
BUY
3243.00
Sobha
22-Sep-21
BUY
729.00
Lemon Tree Hotel
23-Sep-21
BUY
43.25
Whirlpool India
29-Sep-21
BUY
2,299
Ramkrishna Forg.
13-Oct-21
BUY
1,220
HCL Technologies
20-Dec-21
BUY
1,159
Source: Company, Angel Research

January 2022
15
Top Picks Report – January 2022
New Year Special
Research Team Tel: 022 - 40003600 E-mail: [email protected] Website: www.angelone.in
DISCLAIMER
Angel One Limited (hereinafter referred to as “Angel”) is a registered Member of National Stock Exchange of India Limited, Bombay Stock
Exchange Limited and Metropolitan Stock Exchange Limited. It is also registered as a Depository Participant with CDSL and Portfolio
Manager and investment advisor with SEBI. It also has registration with AMFI as a Mutual Fund Distributor. Angel One Limited is a registered
entity with SEBI for Research Analyst in terms of SEBI (Research Analyst) Regulations, 2014 vide registration number INH000000164. Angel
or its associates has not been debarred/ suspended by SEBI or any other regulatory authority for accessing /dealing in securities Market.
This document is solely for the personal information of the recipient, and must not be singularly used as the basis of any investment
decision. Nothing in this document should be construed as investment or financial advice. Each recipient of this document should make
such investigations as they deem necessary to arrive at an independent evaluation of an investment in the securities of the companies
referred to in this document (including the merits and risks involved), and should consult their own advisors to determine the merits and
risks of such an investment.
Angel or its associates or research analyst or his relative may have actual/beneficial ownership of 1% or more in the securities of the subject
company at the end of the month immediately preceding the date of publication of the research report. Neither Angel or its associates nor
Research Analysts or his relative has any material conflict of interest at the time of publication of research report.
Angel or its associates might have received any compensation from the companies mentioned in the report during the period preceding
twelve months from the date of this report for services in respect of managing or co-managing public offerings, corporate finance,
investment banking or merchant banking, brokerage services or other advisory service in a merger or specific transaction in the normal
course of business. Angel or its associates did not receive any compensation or other benefits from the companies mentioned in the report
or third party in connection with the research report. Neither Angel nor its research analyst entity has been engaged in market making
activity for the subject company.
Reports based on technical and derivative analysis center on studying charts of a stock's price movement, outstanding positions and trading
volume, as opposed to focusing on a company's fundamentals and, as such, may not match with a report on a company's fundamentals.
Investors are advised to refer the Fundamental and Technical Research Reports available on our website to evaluate the contrary view, if
any.
The information in this document has been printed on the basis of publicly available information, internal data and other reliable sources
believed to be true, but we do not represent that it is accurate or complete and it should not be relied on as such, as this document is for
general guidance only. Angel One Limited or any of its affiliates/ group companies shall not be in any way responsible for any loss or damage
that may arise to any person from any inadvertent error in the information contained in this report. Angel One Limited has not independently
verified all the information contained within this document. Accordingly, we cannot testify, nor make any representation or warranty,
express or implied, to the accuracy, contents or data contained within this document. While Angel One Limited endeavors to update on a
reasonable basis the information discussed in this material, there may be regulatory, compliance, or other reasons that prevent us from
doing so.
This document is being supplied to you solely for your information, and its contents, information or data may not be reproduced,
redistributed or passed on, directly or indirectly.
Neither Angel One Limited, nor its directors, employees or affiliates shall be liable for any loss or damage that may arise from or in
connection with the use of this information. Angel or its associates or Research Analyst or his relative might have financial interest in the
subject company. Research analyst has not served as an officer, director or employee of the subject company.
Ratings (Based on Expected Returns: Buy (> 15%) Accumulate (5% to 15%) Neutral (-5 to 5%)
Over 12 months investment period) Reduce (-5% to -15%) Sell (< -15%)
Hold (Fresh purchase not recommended)

January 2022
16
Top Picks Report – January 2022
New Year Special
